018 - Key performance indicators
Purpose
In order to assess the performance of the service and user satisfaction, we must measure and assess a range of Key Performance Indicators (KPIs).
Context and scope
This aligns with the requirements of GDS Service standard 10: “Work out what success looks like for your service and identify metrics which will tell you what’s working and what can be improved, combined with user research.”
Goals of this design documentation include:
- To briefly outline what success looks like for Monitor Space Hazards
- To document the KPIs that Monitor Space Hazards has chosen to focus on and how these will be measured
- To assess the benefits of the service to users, linking back to user needs
- To consider the addition of new KPIs as the service develops
What does success look like for Monitor Space Hazards?
Through the creation of Monitor Space Hazards, the UKSA hopes to develop a central UK system that will notify users about upcoming conjunction and re-entry events, collating information into one place and sharing additional analysis conducted by UK orbital analysts. The UKSA aims to create an easy-to-understand but high quality service.
We have identified a number of metrics that will help us determine the performance of the service and what can be improved, that will be outlined below.
Mandatory KPIs
According to the GDS, it is mandatory to publish data on 4 main key performance indicators; cost per transaction, completion rate, user satisfaction and digital take up.
As Monitor Space Hazards is not a transactional service, we will not report on Cost per transaction and Completion rate.
User satisfaction:
- Whilst being an essential performance metric to all services, user satisfaction is a more challenging metric to quantify and largely relies on interacting with our users (through the feedback banner on site, users being invited to stand-ups after releases or incidents, and surveys throughout beta) and asking them to explain:
- Satisfaction levels with the service
- How Monitor Space Hazards changed user behaviour and/or informed decision making
- Whether the information was easy to understand and use
- How long it took to study and understand the information provided by the service
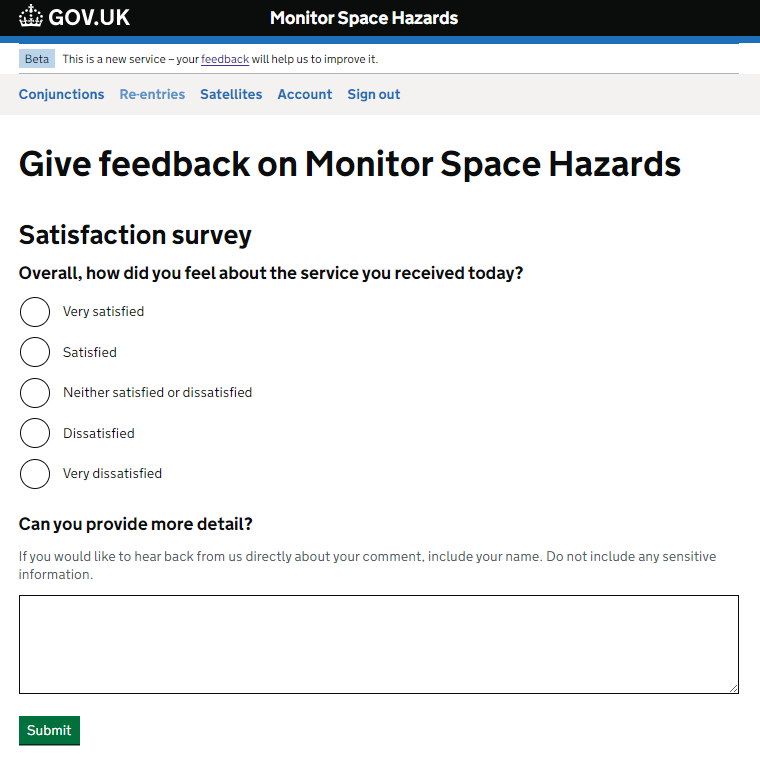
Here is a screenshot of the current feedback form for all users, based on GDS examples. The feedback form is accessible by users from the beta banner that displays at the top of all pages:
Digital take-up
- As Monitor Space Hazards is not replacing an existing service/non-digital channel, digital take up will be monitored by measuring:
- The number of Satellite Operators onboarded to the service as a proportion of the industry.
- The number of Government Organisations onboarded that have need to receive conjunction, re-entry and compliance data.
Additional KPIs specific to monitoring the success of Monitor Space Hazards
During the beta, key outputs to be assessed have been split into 2 categories; user behaviour and technical activity.
User behaviour will be moniotred by looking at:
- User onboarding
- Number of active operators onboarded (in service)
- Number of organisations onboarded (in service)
- Number of users onboarded (in service)
- Number of satellites tracked (in service)
- Increasing user adoption
- Number of unique logins (Auth0)
- Monthly sessions (Google Analyltics - sessions)
- Monthly API calls (AWS Athena)
- Notifications sent - Email (GOV.UK Notify)
- Notifications sent - SMS (GOV.UK Notify)
- User satisfaction
- Webform response (GetForm)
- Webform average (GetForm)
- Accessibility performance
- WAVE errors reported (WAVE)
Technical activity will be monitored by looking at:
- Service availability
- Availability - Web interface (Pingdom)
- Availability - API (Pingdom)
- Incident response
- Number of Incidents (Pingdom status page)
- Average response and resolution time (Pingdom status page)
- Development tracking
- Successful deployments to DEV (GitHub)
- Successful deployments to PROD (GitHub)
We also track finances and budgeting against resources and have monthly check-ins with SRO and UKSA governance to report on KPIs.
